

CLICK HERE FOR A FULL VERSION OF THE NEWSLETTER
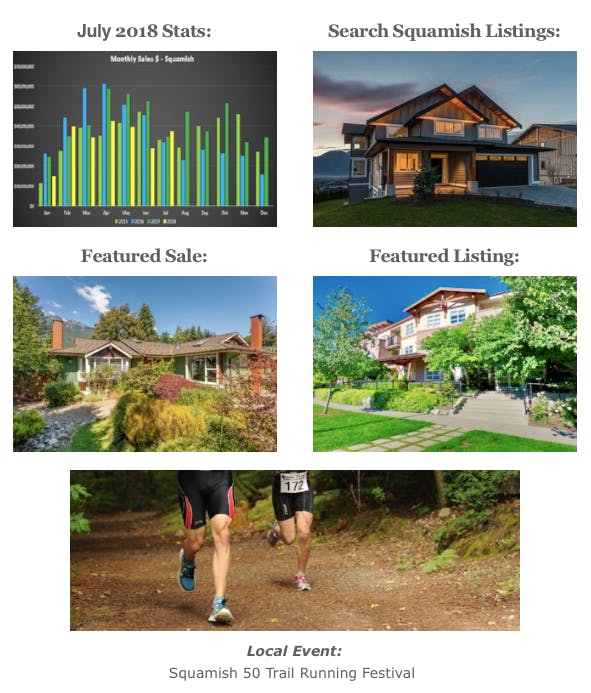
July 2018 Stats:
For a complete overview, check out the video above!!
Sales to active listings ratio= 19% for July 2018, compared to 15% June 2018 and 32% in July 2017.
With an overall figure of 19% Squamish is just dipping it’s toes back into a sellers’ market. Breaking that down into property types the biggest change was with detached properties coming up to 13% from 7% last month, however that category continues to sit in a balanced market: Detached = 13%, Condos = 31%, + Townhomes = 30%.
- **This ratio is calculating the monthly sales compared to the total # of listings, basically if there were no other listings how long would it take for the listings to run out.
- Referencing this statistic: <12% is a buyers market and puts downward pressure on price, between 12%-20% is a balanced market with no pressure on price, >20% is a sellers market with upward pressure on price.
HPI Benchmark Price:
- Detached: July 2018 = $1M that’s $68.5k higher than July 2017.
- Townhomes: July 2018 = $974k, that’s $204k higher than July 2017.
- Condos: July 2018 = $536k, that’s $90.5k higher than July 2017.
In the last 30 days: 77% of properties in Squamish have sold for under the list price last month that figure was 82%. Just 6% sold over-asking and 17% sold at the list price.
Inventory decreased a little in July to 257 but this is still higher than July 2017 which saw a figure of just 210.
Days on market has dropped from 44 days in June to 38 days in July.