CLICK HERE FOR A FULL VERSION OF THE NEWSLETTER
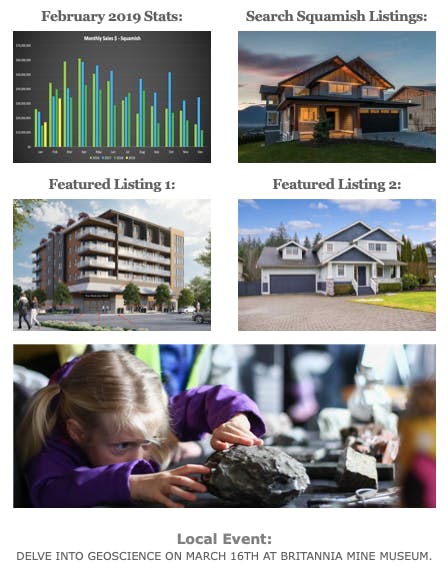
Sales to active listings ratio=17% for February 2019. That figure increased from 11% last month, keeping Squamish in a balanced market.
Breaking that down into property types: Detached =14% up from just 8% in January, Condos = 9%, Townhomes = Increased to 42% a huge jump from last month’s 16%.
- **This ratio is calculating the monthly sales compared to the total # of listings, basically if there were no other listings how long would it take for the listings to run out.
- Referencing this statistic: <12% is a buyer’s market and puts downward pressure on price, between 12%-20% is a balanced market with no pressure on price, >20% is a seller’s market with upward pressure on price.
HPI Benchmark Price:
- Detached: Feb 2019 = $1M that’s almost $18k higher than Feb 2018.
- Townhomes: Feb 2019 = $658k, that’s $16k lower than Feb 2018.
- Condos: Feb 2019 = $459k, that’s $29k lower than Feb 2018.
In the last 30 days: 90% of properties in Squamish sold for under the list price, 4% of properties sold at list price and 6% sold over ask.
Inventory continued to increase to 226, In Feb 2018 when we saw a figure of just 164.
Average days on market increased to 78, In Feb 2018 that figure was 32 Days.


