

CLICK HERE FOR A FULL VERSION OF THE NEWSLETTER
June 2019 Year to Date Whistler Real Estate Stats:
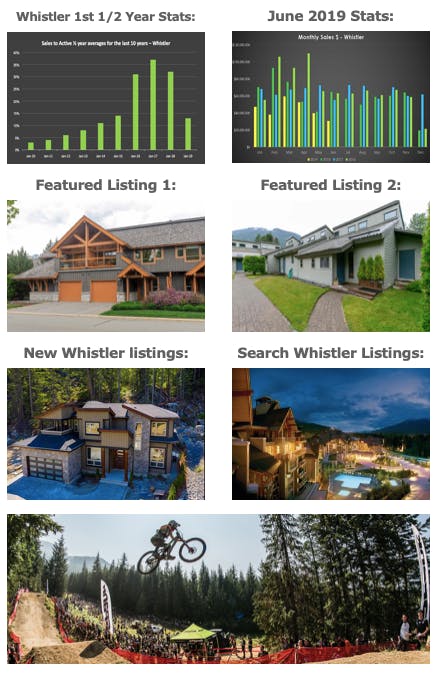
Sales to Active Ratio
- Sales divided by total inventory, showing what percent sold.
- Average for the 1st ½ of 2019 was 13%. That puts the 1st half of the year at the bottom end of a balanced market.
- That’s 52% lower than the 5 year average, and 28% lower than the 10 year average.
Sales
- 2019 1st ½ year sales # = 250.
- That’s the lowest 1st ½ year of sales in the past 5 years.
- That’s 33% lower than the 5 year average for 1st ½ year of sales, 16% lower than the 10 year average, and 7 % lower than the 20 year average.
- Noteworthy point: even though 2019 seems quite low compared to the 5 + 10 year averages, the last downward market we experienced, 2009 to 2013, every single 1st ½ year of sales in those years were lower than 2019 is so far.
Inventory
- 2019 1st ½ yr inventory average = 250
- That’s 8.5% higher than the 5 year average, but 29% lower than the 10 year average.
HPI Benchmark Price
- Basically, this is the average price but slightly more accurate.
- Average HPI benchmark price for a detached home in the 1st ½ of 2019 was $1.54M.
- 2018 = $1.64M & 2017 = $1.47M.
Bottom Line
- We know we are in a down market, we just don’t know how long it will last for.
- Even though it feels like the market is abnormally slow, we’ve seen slower in the last downward cycle. It just feels really slow now because of the feeding frenzy we saw between 2015 and 2017.