

CLICK HERE FOR A FULL VERSION OF THE NEWSLETTER
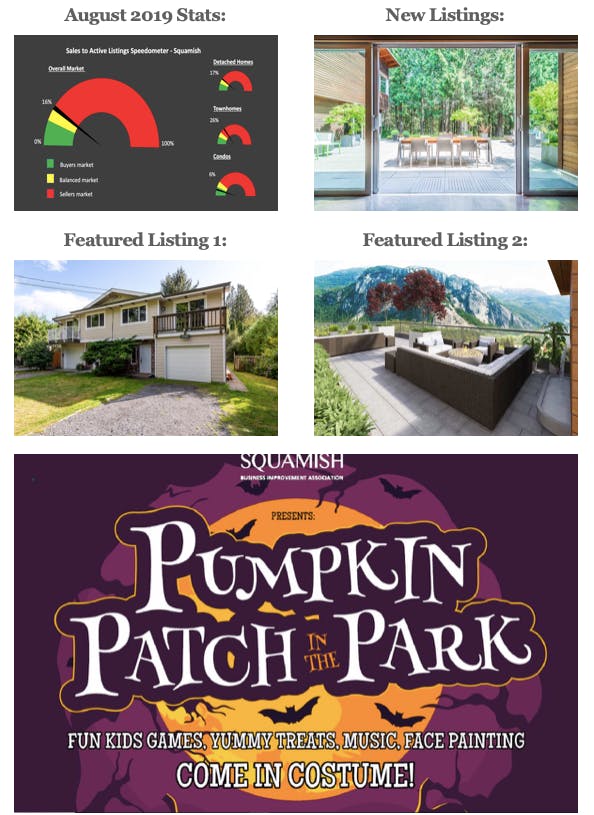
- Aug 2019 Overall = 16%
- Detached homes = 17%
- Condos = 6%
- Townhomes = 26%
- Higher than last month = 13%
- Lower than Aug 2018 = 20%
- Lower than 5yr Aug average = 22%
- Higher than 10yr Aug average = 15%
**Buyer’s market = <12% / Balanced market = 12%-20% / Seller’s market = >20%**
Sales:
- Aug 2019 Sales = 40
- Up from last month = 36
- Down from Aug 2018 = 51
- Down from 5 yr avg = 50
- 20% lower than 5 yr avg
- UP from 10 yr avg = 39
- 3% Higher than 10 yr avg
Inventory:
- Aug 2019 = 254
- Less than last month = 269
- About the same as Aug 2018 = 252
- Higher than the 5 yr avg = 229
- Lower than the 10 yr avg = 324
Overall, what’s going on:
August was a more active month than June or July, it was about as active as the Spring market. Seems like Aug 2019 was more similar to the 10 yr Aug avg and slower than the 5 yr avg. As I’m sending this update we are well into September, and I can tell you that the market is heating up! Could be a flash heat, could be the real deal. Time will tell, you’ll have to wait for the next market update to find out!