

CLICK HERE FOR A FULL VERSION OF THE NEWSLETTER
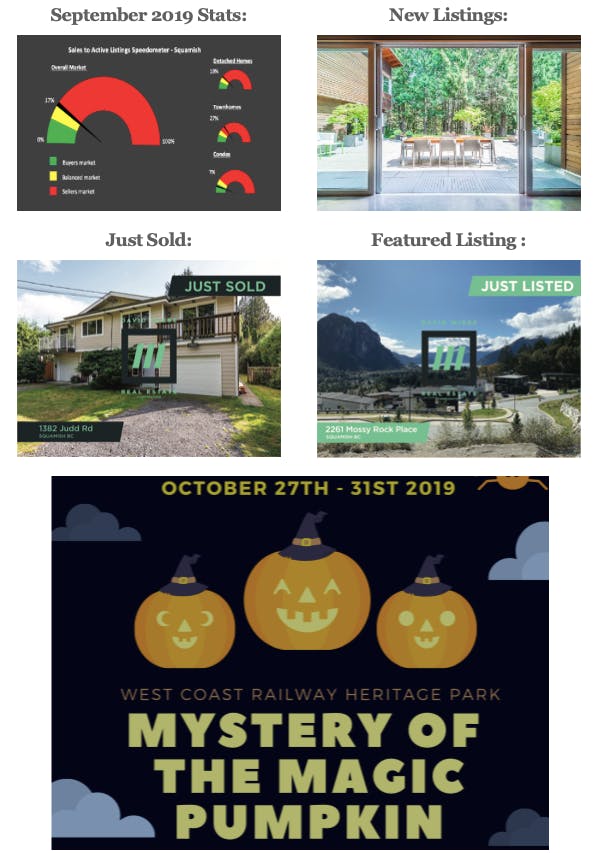
Sales to active ratio:
- Sept 2019 Overall = 17%
- Detached homes = 19%
- Condos = 7%
- Townhomes = 27%
- Higher than last month = 15%
- Higher than Sept 2018 = 9%
- Lower than 5yr Sept average = 23%
- Higher than 10yr Sept average = 16%
**Buyer’s market = <12% / Balanced market = 12%-20% / Seller’s market = >20%**
Sales:
- Sept 2019 Sales = 45
- Up from last month = 40
- Up from Sept 2018 = 23
- Down from 5 yr avg = 49
- 9% lower than 5 yr avg
- UP from 10 yr avg = 40
- 12% Higher than 10 yr avg
Inventory:
- Sept 2019 = 260
- Less than last month = 262
- Less than Sept 2018 = 269
- Higher than the 5 yr avg = 226
- Lower than the 10 yr avg = 319
Overall what’s going on:
September was an active month for real estate. We talked about the # of sales, but we didn’t talk about the dollar volume. September 2019 had the highest dollar volume of sales for as long as I can look back, likely it was the highest dollar volume for sales in Squamish ever. Sept 2017 was really close, but other than that no other September came close. I’m so used to saying “the lowest in the last 4 years”, it’s nice to be able to say it was the strongest month in the last however many years. September started off pretty average, then ½ way in it started to heat up. As I make this video we are well into October, and I can tell you that the market is still going strong. It will be interesting to see if October is stronger than September, you’ll just have to wait for the next market update to find out!