

CLICK HERE FOR A FULL VERSION OF THE NEWSLETTER
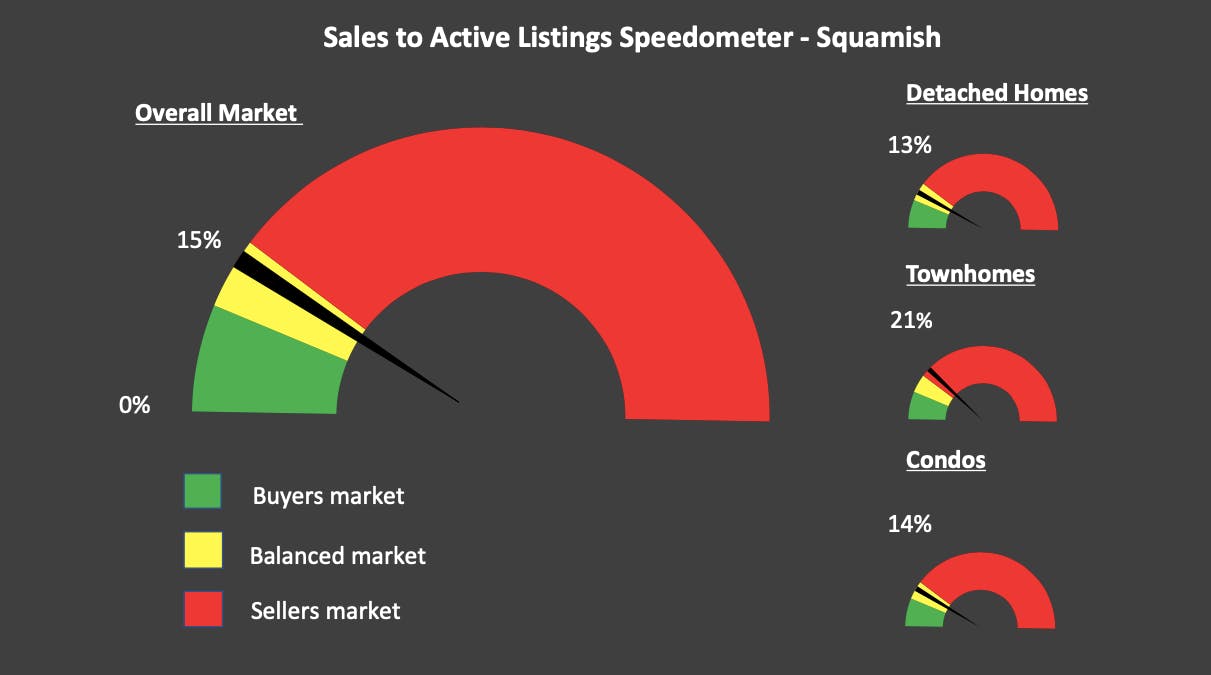
Sales to active ratio:
- December 2023 = 12%
- Detached homes = 3%
- Condos = 17%
- Townhomes = 15%
- Lower than last month = 15%
- Lower than December 2022 = 18%
- Lower than 5yr December average = 21%
- Lower than 10yr December average = 20%
- **Buyer’s market = <12% / Balanced market = 12%-20% / Seller’s market = >20%**
Sales:
- December 2023 = 25
- Lower than as last month = 34
- Lower than December 2022 = 32
- Lower than 5 yr avg = 36
- 30% Lower than 5 yr avg
- Lower than 10 yr avg = 41
- 39% Lower than 10 yr avg
Inventory:
- December 2023 = 214
- Lower than last month =223
- Higher than December 2022 = 175
- Higher than the 5 yr avg = 196
- Lower than the 10 yr avg = 235
In a nutshell
Slow sales for this time of year, even though this is typically a slower time of year, it was slow even for this time of year! Inventory levels are starting to rise, now hovering between the 5 + 10 year average levels for this time of year. The outlook for 2024 looks good though! Rate cuts are expected, the general thought process for industry experts is that 2024 will be a good year for sales and prices. If you’re thinking of getting off the sidelines, the sooner the better. Reach out with any questions, I’m happy to help find you the perfect place!