

CLICK HERE FOR A FULL VERSION OF THE NEWSLETTER:
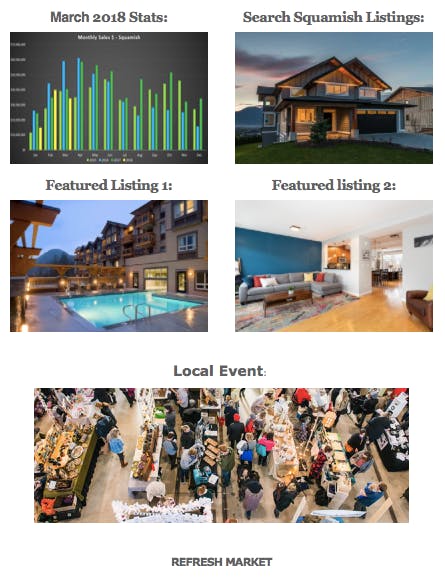
- Sales to active listings ratio = 28% for March 2018, compared to 34% February 2018 and 32% in March 2017.**This ratio is calculating the monthly sales compared to the total # of listings, basically if there were no other listings how long would it take for the listings to run out. At 35% it would take just over 3 months.
**This ratio is calculating the monthly sales compared to the total # of listings, basically if there were no other listings how long would it take for the listings to run out. At 35% it would take just over 3 months.
Referencing this statistic: <12% is a buyers market and puts downward pressure on price, between 12%-20% is a balanced market with no pressure on price, >20% is a sellers market with upward pressure on price.
- HPI Benchmark Price:
Detached: March 2018 = $1M that’s $88k higher than March 2017.
Townhomes: March 2018 = $851k, that’s $110k higher than March 2017.
Condos: March 2018 = $491k, that’s $113k higher than March 2017.
- In the last 30 days: 65% of properties in Squamish have sold for under the list price, 24% sold over-asking and 11% sold at the list price.
- Inventory continues to increase slightly up to 168. In March 2017 this figure was 219.
- Days on market increased to 19 for the month of March, in February it was at a low of just 12 days.