

CLICK HERE FOR A FULL VERSION OF THE NEWSLETTER
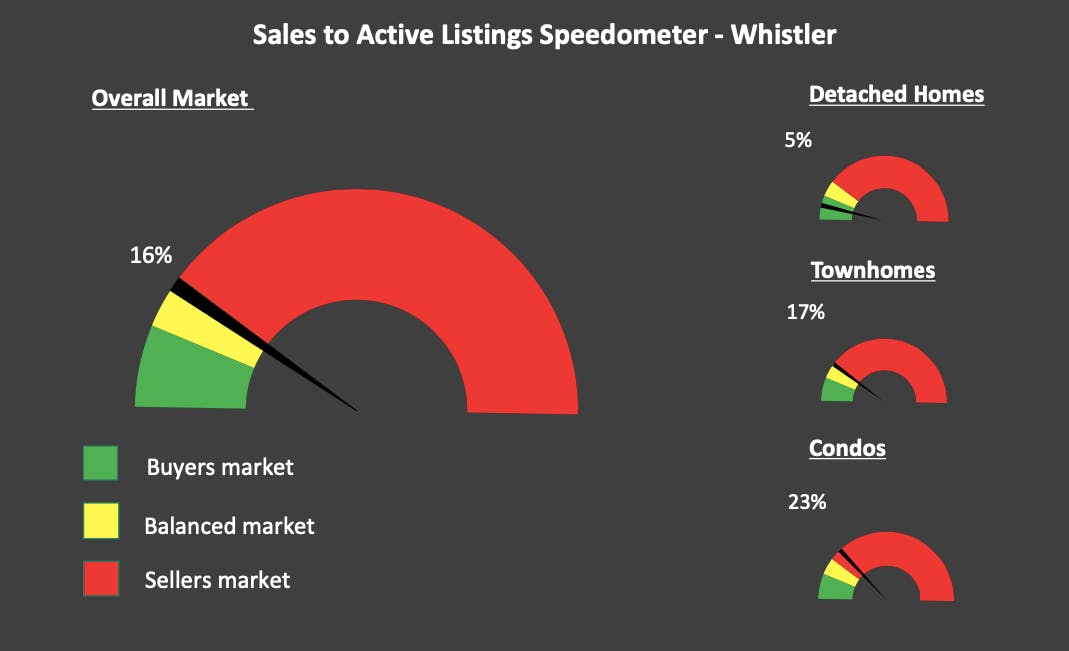
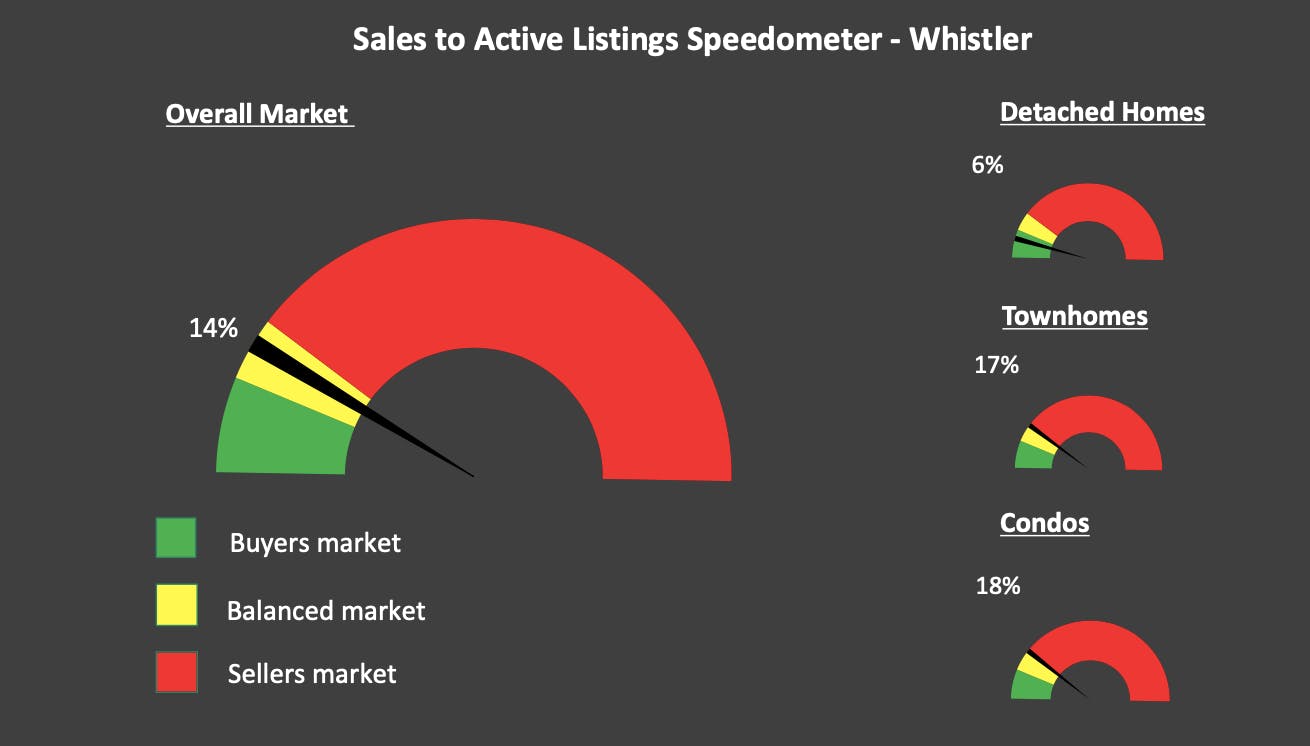
Sales to active ratio:
- March 2024 = 16%
- Detached homes = 5%
- Condos = 23%
- Townhomes = 17%
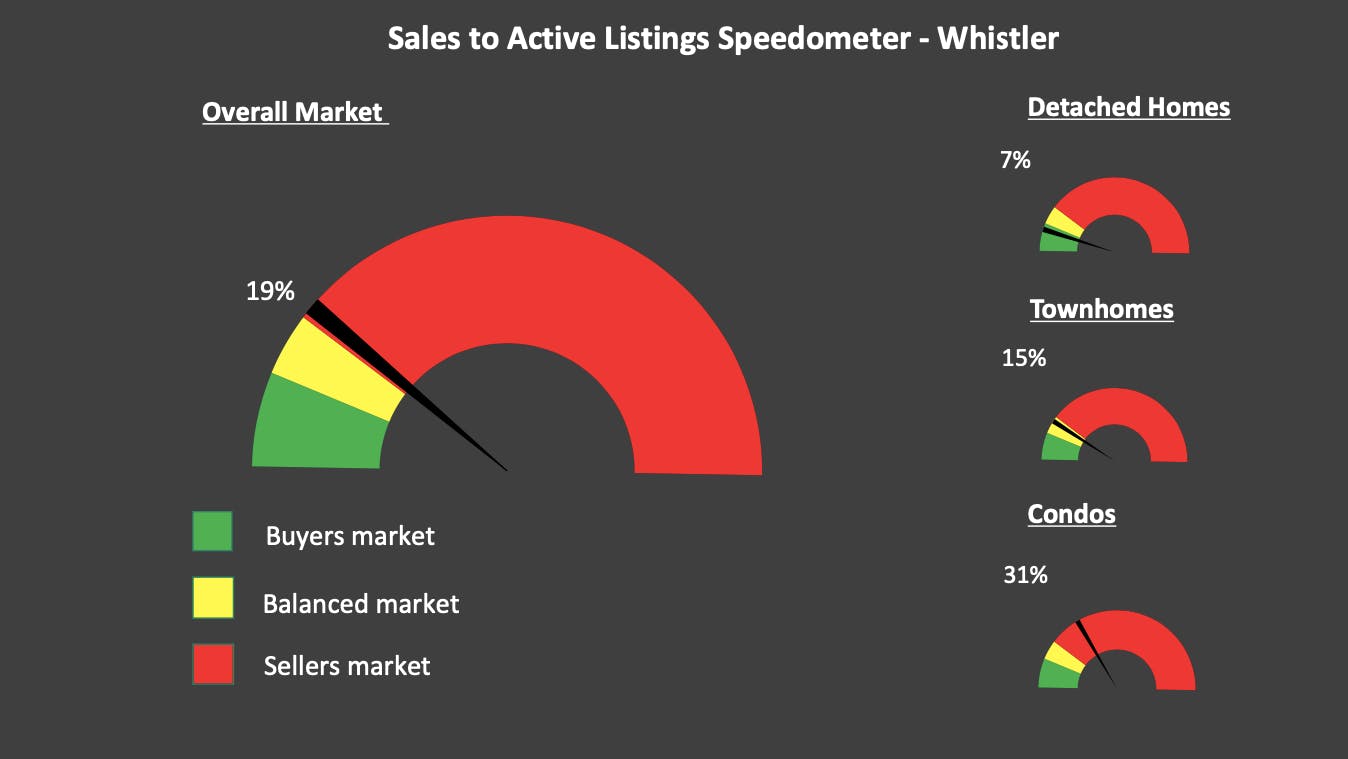
- Lower than last month = 19%
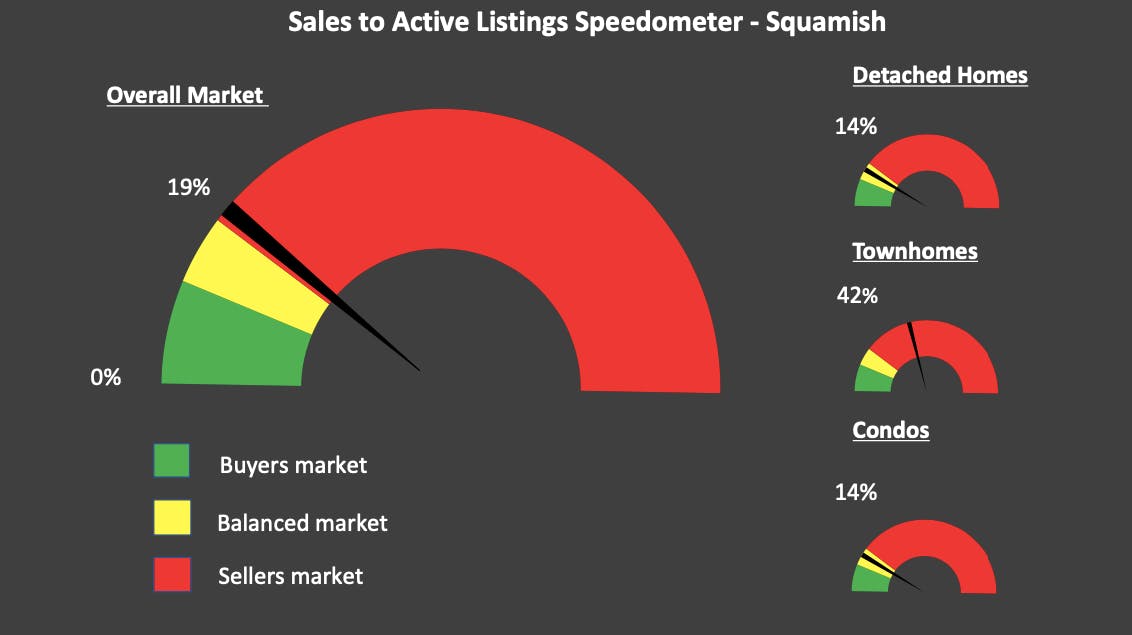
- Lower than March 2023 = 21%
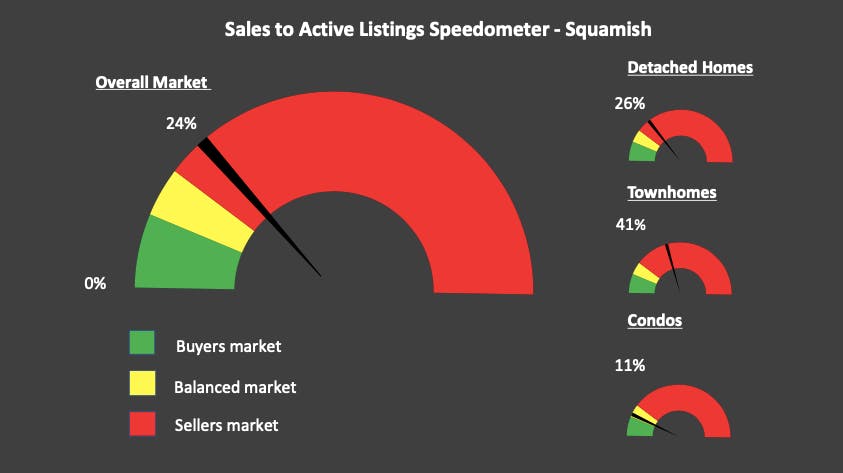
- Lower than 5yr March average = 25%
- Lower than 10yr March average = 28%
- **Buyer’s market = <12% / Balanced market = 12%-20% / Seller’s market = >20%**
Sales:
- March 2024 = 43
- Lower than as last month = 45
- Higher than March 2023 = 42
- Lower than 5 yr avg = 66
- 35% Lower than 5 yr avg
- Lower than 10 yr avg = 62
- 31% Lower than 10 yr avg
Inventory:
- March 2024 = 263
- Higher than last month =242
- Higher than March 2023 = 200
- Lower than the 5 yr avg = 291
- Higher than the 10 yr avg = 258
In a nutshell
The market felt a lot busier than the numbers reveal! The number of sales for March was one of the lowest March in the last 10 years. Inventory is hovering between the 5 + 10 year averages. Either a property will go multiple offers, or it won’t even get showings, extremes on both sides!