
Blog
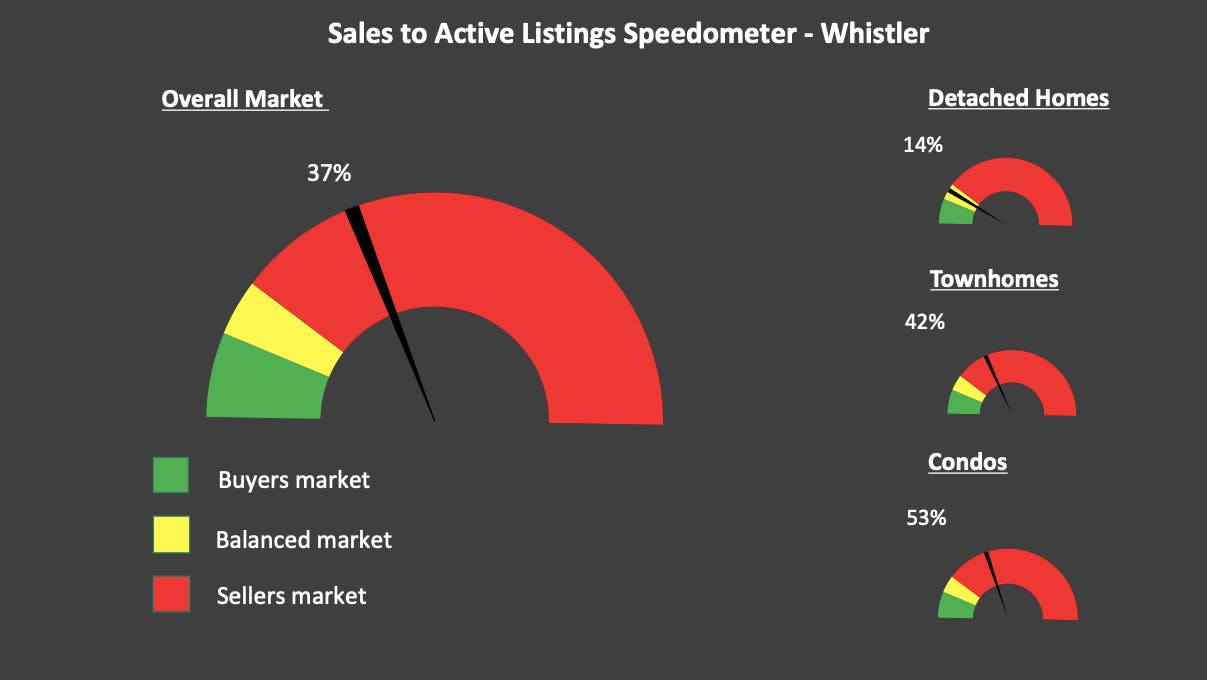
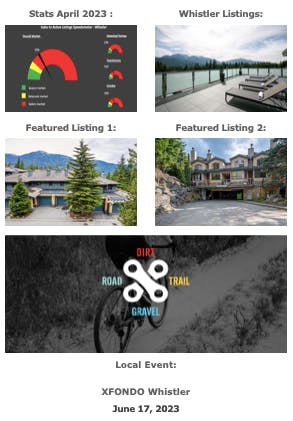
Whistler Real Estate Update – May 2023
CLICK HERE FOR A FULL VERSION OF THE NEWSLETTER
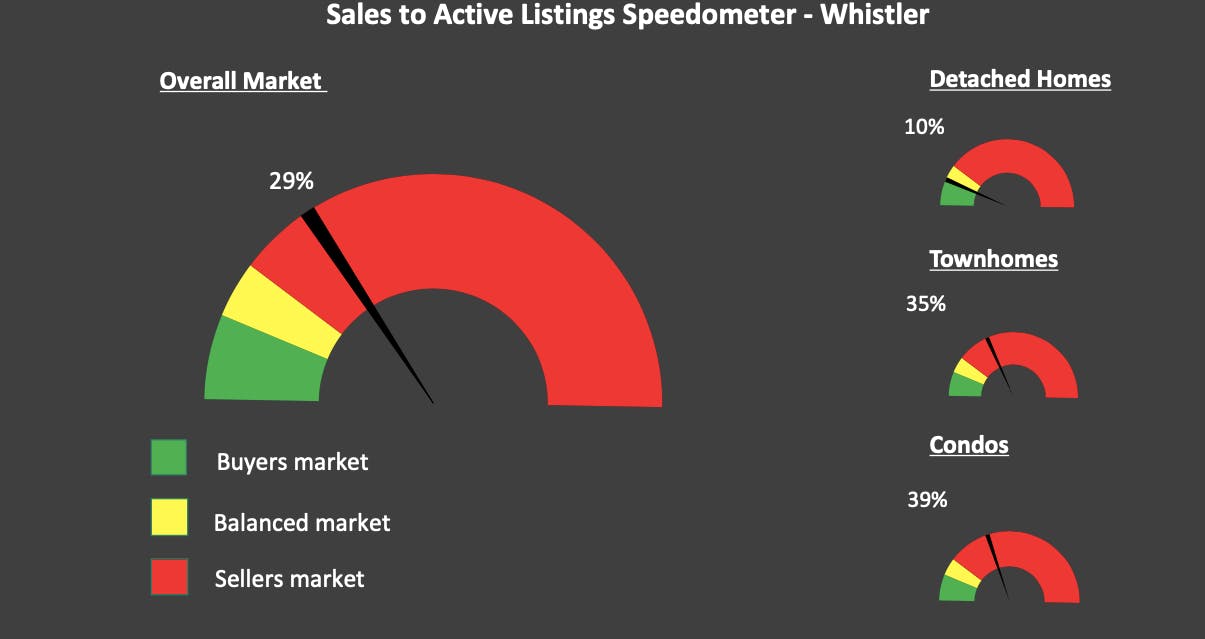
Sales to active ratio:
- April 2023 = 29%
- Detached homes = 10%
- Condos = 39%
- Townhomes = 35%
- Higher than last month = 21%
- Lower than April 2022 = 45%
- Higher than 5yr April average = 26%
- Higher than 10yr April average = 25%
- **Buyer’s market = <12% / Balanced market = 12%-20% / Seller’s market = >20%**
Sales:
- April 2023 = 50
- Higher than as last month = 42
- Lower than April 2022 = 59
- Higher than 5 yr avg = 46
- 9% Higher than 5 yr avg
- Lower than the 10 yr avg = 54
- 7% lower than 10 yr avg
Inventory:
- April 2023 = 171
- Lower than last month =198
- Higher than April 2022 = 132
- Lower than the 5 yr avg = 212
- Lower than the 10 yr avg = 272
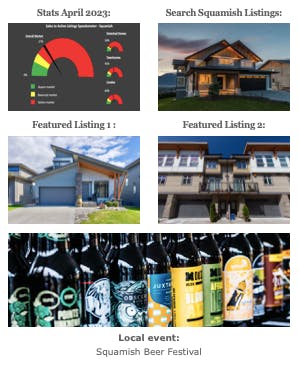
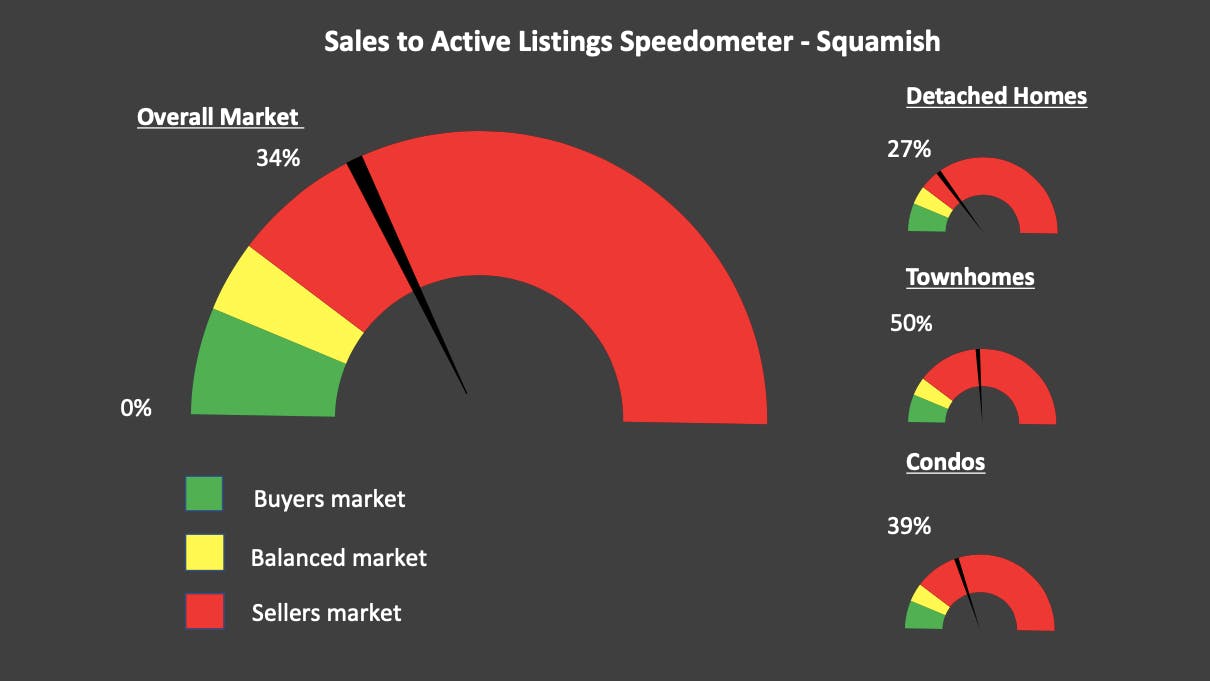
Squamish Real Estate Update – May 2023
CLICK HERE FOR A FULL VERSION OF THE NEWSLETTER
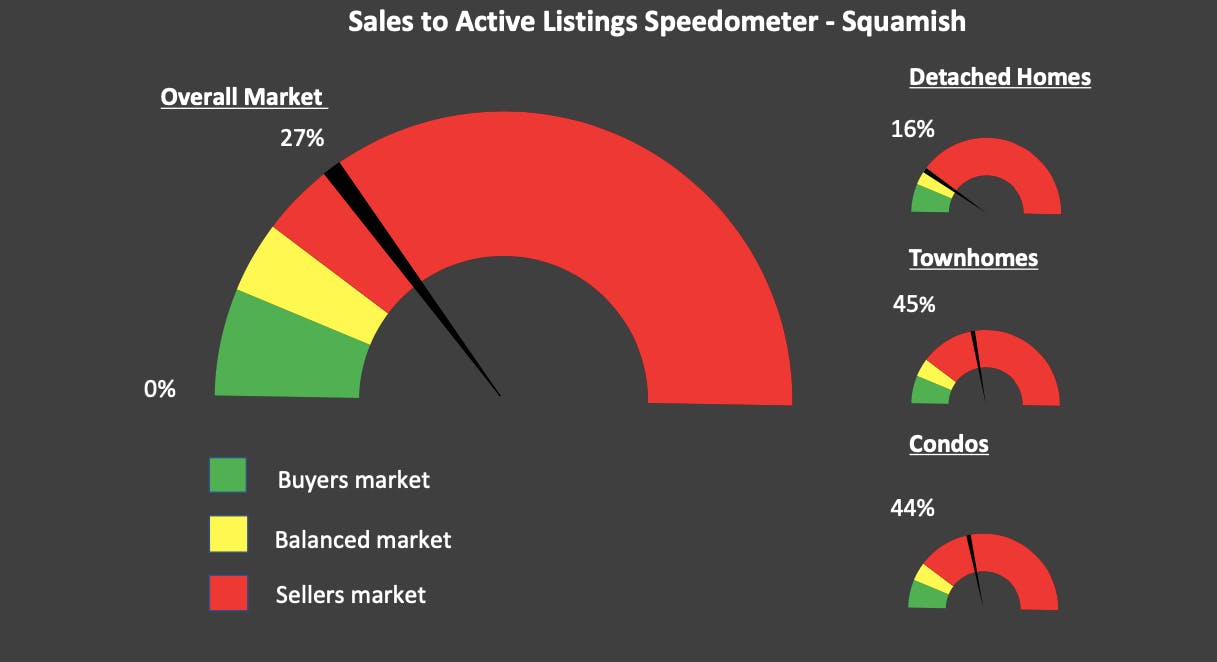
Sales to active ratio:
- April 2023 = 27%
- Detached homes = 16%
- Condos = 44%
- Townhomes = 45%
- Lower than last month = 33%
- Lower than April 2022 = 38%
- Lower than 5yr April average = 29%
- Lower than 10yr April average = 30%
- **Buyer’s market = <12% / Balanced market = 12%-20% / Seller’s market = >20%**
Sales:
- April 2023 = 40
- Lower than last month = 48
- Lower than April 2022 = 52
- Lower than 5 yr avg = 50
- 20% lower than 5 yr avg
- Lower than the 10 yr avg = 58
- 31% lower than 10 yr avg
Inventory:
- April 2023 = 151
- Higher than last month =147
- Higher than April 2022 = 137
- Lower than the 5 yr avg = 216
- Lower than the 10 yr avg = 183
In a nutshell
Meh. Hahaha, that’s the word I’m choosing for how the real estate market is moving along. April sales were just ok, on the lower end of the sales for the last decade of Aprils. Inventory is still relatively low, still lower than 5 + 10 year April averages. I thought the later part spring would have been stronger because of the lack of interest rate hikes, but I was wrong, The market is especially slow in the detached $1.5M-$2M range. I don’t anticipate things picking up much over summer, but I was wrong before so maybe I’ll be wrong again! Bring on summer, let’s see what happens.

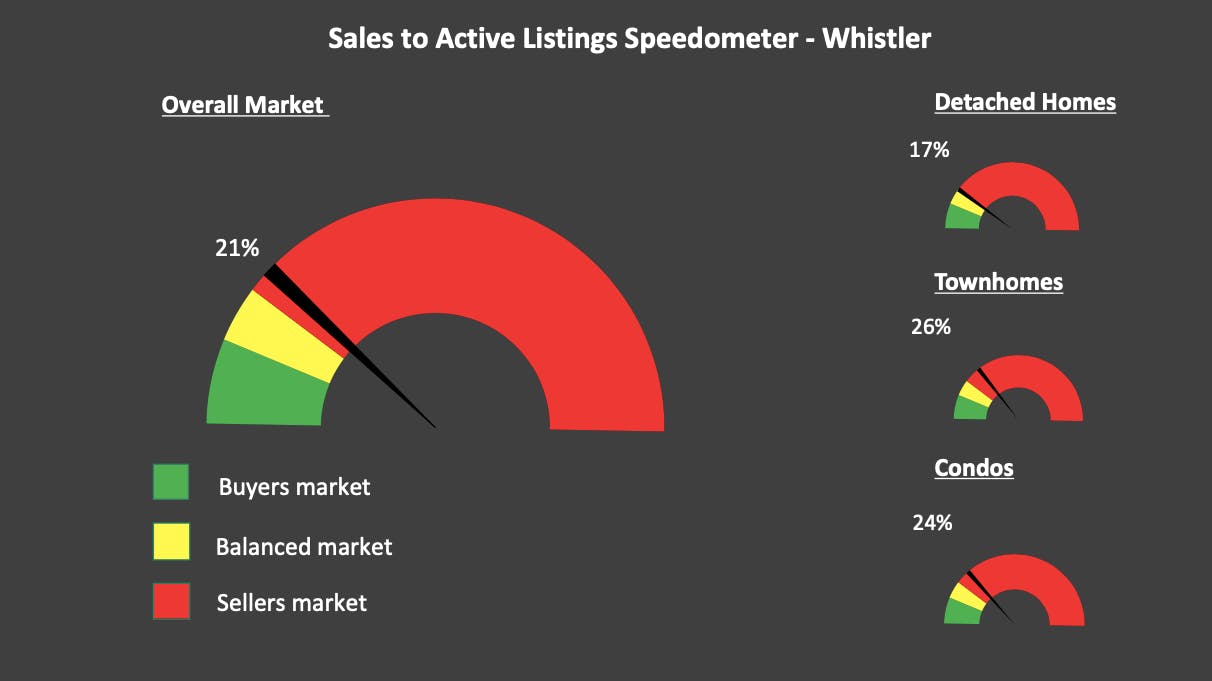
Whistler Real Estate Update – April 2023
CLICK HERE FOR A FULL VERSION OF THE NEWSLETTER
Sales to active ratio:
- March 2023 = 21%
- Detached homes = 17%
- Condos = 24%
- Townhomes = 26%
- Higher than last month = 20%
- Lower than March 2022 = 60%
- Lower than 5yr March average = 33%
- Lower than 10yr March average = 28%
- **Buyer’s market = <12% / Balanced market = 12%-20% / Seller’s market = >20%**
Sales:
- March 2023 = 42
- Higher than as last month = 38
- Lower than March 2022 = 72
- Lower than 5 yr avg = 60
- 30% lower than 5 yr avg
- Lower than the 10 yr avg = 62
- 32% lower than 10 yr avg
Inventory:
- March 2023 = 196
- Higher than last month = 188
- Higher than March 2022 = 119
- Lower than the 5 yr avg = 215
- Lower than the 10 yr avg = 280
In a nutshell
The market is quite busy! No longer am I saying “this was the lowest____(fill in the month) in the last 10 years”. March wasn’t setting any records with sales, but it wasn’t the lowest March in the last decade. Inventory is still extremely low. The last few pause announcements in the overnight lending rate has given buyers some confidence in buying again, I expect to see a strong spring market continue into early summer….then we will have to wait and see!

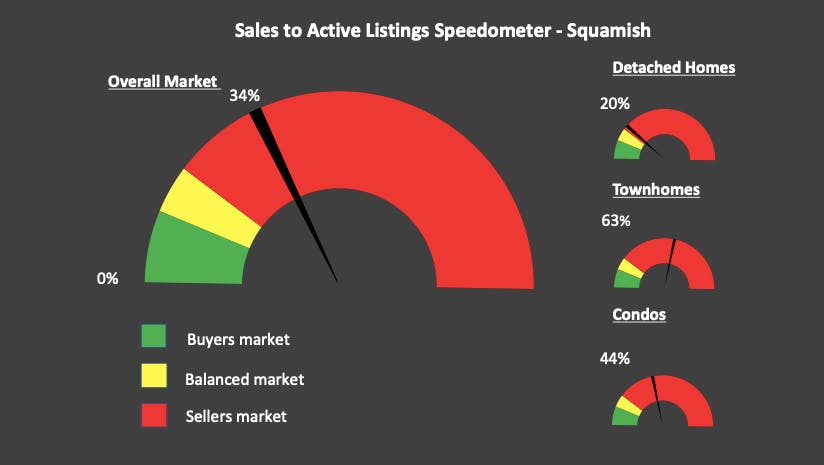
Squamish Real Estate Update – April 2023
CLICK HERE FOR A FULL VERSION OF THE NEWSLETTER
Sales to active ratio:
- March 2023 = 34%
- Detached homes = 20%
- Condos = 44%
- Townhomes = 63%
- Higher than last month = 19%
- Lower than March 2022 = 70%
- Lower than 5yr March average = 40%
- Lower than 10yr March average = 35%
- **Buyer’s market = <12% / Balanced market = 12%-20% / Seller’s market = >20%**
Sales:
- March 2023 = 48
- Higher than last month = 28
- Lower than March 2022 = 71
- Lower than 5 yr avg = 59
- 18% lower than 5 yr avg
- Lower than the 10 yr avg = 59
- 18% lower than 10 yr avg
Inventory:
- March 2023 = 142
- Lower than last month =147
- Higher than March 2022 = 102
- Lower than the 5 yr avg = 162
- Lower than the 10 yr avg = 205
In a nutshell
The market is quite busy! No longer am I saying “this was the lowest____(fill in the month) in the last 10 years”. March wasn’t setting any records with sales, but it wasn’t the lowest March in the last decade. Inventory is still extremely low. The last few pause announcements in the overnight lending rate has given buyers some confidence in buying again, I expect to see a strong spring market continue into early summer….then we will have to wait and see!