

CLICK HERE FOR A FULL VERSION OF THE NEWSLETTER
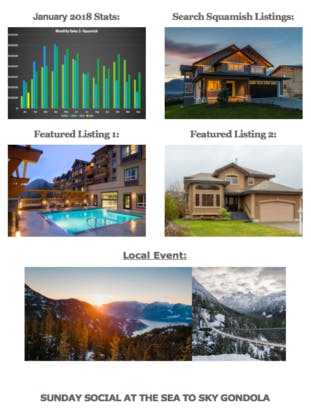
- Sales to active listings = 15% for Jan 2018, compared to 38% December 2017 and just 16% in Jan 2017.
- **This ratio is calculating the monthly sales compared to the total # of listings, basically if there were no other listings how long would it take for the listings to run out. At 35% it would take just over 3 months.
- Referencing this statistic: <12% is a buyers market and puts downward pressure on price, between 12%-20% is a balanced market with no pressure on price, >20% is a sellers market with upward pressure on price.
- HPI Benchmark Price:
-
- Detached: Jan 2018 = $1M, that’s $158k higher than Jan 2017.
- Townhomes: Jan 2018 = $786k, that’s $137k higher than Jan 2017.
- Condos: Jan 2018 $490k, that’s $119k higher than Jan 2017.
- In the last 30 days 60% of properties in Squamish have sold for under the list price. 15% sold over-asking and 25% sold at the list price.
- We have seen a substantial increase in the number of new properties on the market in Squamish for Jan rising to 80, in Dec 2017 we had just 26.