

CLICK HERE FOR A FULL VERSION OF THE NEWSLETTER
August 2019 Stats
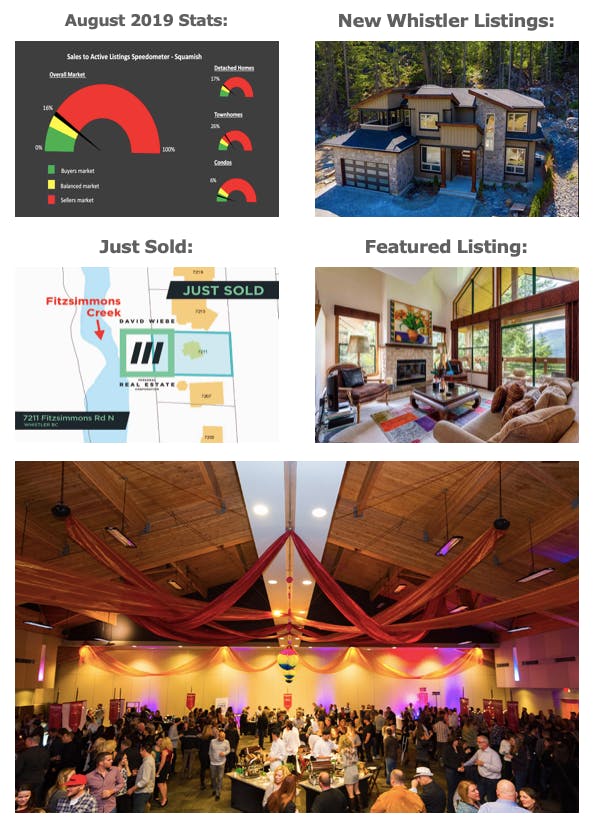
Sales to active ratio:
- Aug 2019 = 16%
- Detached homes = 10%
- Condos = 21%
- Townhomes = 14%
- Higher than the previous month (July 2019) = 10%
- Lower than Aug 2018 = 19%
- Lower than 5yr Aug average = 23%
- Higher than 10yr Aug average = 15%
**Buyer’s market = <12% / Balanced market = 12%-20% / Seller’s market = >20%**
Sales:
- Aug 2019 = 50
- Higher than the previous month (July 2019) = 31
- Higher than Aug 2018 = 41
- Down from 5 yr avg = 61
- 18% lower than 5 yr avg
- up on the 10 yr avg = 48
- 4% Higher than the 10 yr avg
Inventory:
- Aug 2019 = 310
- Higher than the previous month (July 2019) = 294
- Higher than Aug 2018 = 216
- Higher than the 5 yr avg = 303
- Lower than the 10 yr avg = 429
Overall What’s going on:
August was a more active month than June or July, it was even stronger than the Spring market. Seems like Aug 2019 in general was “worse” than the August 5 yr average, but similar to the August 10 yr avg. As I’m sending this update we are well into September, and I can tell you that the market is heating up! Could be a flash heat, could be the real deal. Time will tell, you’ll have to wait for the next market update to find out!